A whole new ball game
-
- from Shaastra :: vol 05 issue 04 :: Apr 2026

Data, mathematics, and technology are proving to have a game-changing influence on sports fields.
The coach of the Indian men's cricket team was there, as were the coaches of the domestic teams. The meeting was being held at the National Cricket Academy in Bengaluru. All eyes were on a man who had been creating quite a stir by video-recording cricket matches and analysing player performances in depth. By the end of the meeting, a decision had been taken. John Wright, the then coach of the Indian team, asked the sports enthusiast if he would like to join the team as an analyst. Ramakrishnan Subramanian — or Ramky, as he is widely known — said yes.
That was in 2003. The relationship continues to this day.
Ramky had played cricket at the junior State level in Tamil Nadu. While coaching a school cricket team in Chennai, he began video-recording players' practice sessions and then analysing the games. "Watching those recordings, I realised how powerful a video analysis could be," Ramky says. The players' response was overwhelmingly positive. "I found that skill development could be accelerated if we used visual coaching instead of relying only on naked-eye observation."
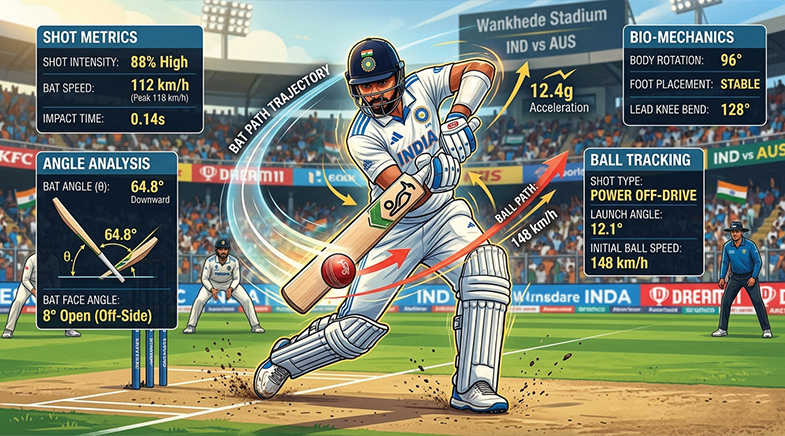
In March 2004, the Indian team travelled to Pakistan for a Test series. Before the series, Ramky noticed opener Virender Sehwag performed best when the angle of his back-lift was about 45 degrees to the crease. When he was out of form, the angle tended to drop to around 30 degrees. The two spent a couple of hours reviewing the footage and discussing the changes in his stance and technique. Once Sehwag became aware of the difference, he adjusted his position. In the first Test of the series in Multan, he scored a triple century. After the match, Sehwag dedicated the innings to Ramky.
The benefits of data-driven analysis are being reaped on the field. Technology was simpler when Ramky joined the Indian team, but numbers, mathematics, and data are now driving modern sport, revealing patterns that had been seen as random. "The core capability of data science hasn't fundamentally changed; it has always been about modelling, prediction, and understanding underlying performance. What's changed over the last three years is the level of adoption within cricket," says Surya Kocherlakota, Head of Data Science, CricViz, a U.K. -based cricket data analytics company. "The sport is increasingly following trends seen in more analytically mature environments like baseball and basketball, where data science is embedded directly into decision-making rather than sitting alongside it."
Sports firms analyse football through a layered statistical framework that moves from basic match events to deeper indicators.
In the past few years, cricket data analysis in India and overseas has made breakthroughs that have helped transform the game, and basic statistics are keeping pace with the advancements in computer vision, real-time data, artificial intelligence (AI), and predictive systems. Kocherlakota points out that driving the shift are the availability of richer data: "more granular ball-by-ball context, more ball-tracking data, the advent of fielding data, and more." Modern cricket, he adds, has more "strategic decision points" than before — from auctions to phase-specific roles.
"Analysis has become more contextual and more actionable. In the past, coaches and analysts might have relied on broad heuristics: this player is good at the death, this bowler matches up well here, this venue suits seam. What data science has done is make those ideas much more precise," he says.
THE RISE OF ANALYTICS
In 2006, Ramky established SportsMechanics India, a company that operates at the intersection of sport, data science, and technology. It positions itself as a strategic consulting and analytics partner for the world of sports. Its work spans performance analytics, digital infrastructure, competition management systems, and fan engagement solutions, making it more than a conventional statistics firm. The company's central philosophy is that sports can be improved — both on the field and off it — through structured data collection, intelligent analysis and decision-support systems that convert information into measurable outcomes.
In India, this shift has been especially rapid, driven by the scale of tournaments such as the Indian Premier League (IPL) and the growth of digital infrastructure, making cricket the largest segment of the country's sports analytics system. According to management consultants IMARC Group, the Indian sports analytics market was valued at around $56 million in 2025 and is expected to grow significantly. Globally, the market has already reached about $5.6 billion and is projected to exceed $23 billion by the early 2030s (bit.ly/Sports-Market). With the increasing quality of sensor and video input and fine-grained match records, cricket is a prime target for analysis. Outside India, other games have also kept pace with cricket.
In football, the British firm Opta Sports has popularised metrics such as expected goals, helping teams evaluate chance rather than just outcomes. In basketball, data from leagues such as the U.S. National Basketball Association (NBA) help track player and ball positions, reshaping strategies such as the increased use of three-point shooting — a successful basket shot from beyond a designated arc. Technologies developed by Hawk-Eye Innovations, a U.K.-based sports tech company, are now standards in tennis and football, enabling precise line calls, ball tracking, and decision-making systems.
Together, these technologies rely on a blend of statistics, machine learning, and mathematical modelling to uncover patterns that are not immediately visible. They help coaches optimise strategies, allow analysts to objectively quantify performance, and enable fans to engage with the game through a deeper, data-driven approach. Sports analytics companies such as Hudl (U.S.), Smrt Stats (Ireland) and Sportradar (Switzerland) are turning match and player data into actionable insights. Coaches are now better equipped with smarter strategies, improving player performance and player selection. Also, the analysis provides fans with a better experience through real-time statistics, predictions, and a deeper understanding of the game.
Kocherlakota stresses how, with the help of AI, particularly large language models, insights are communicated and accessed. "While they don't change the underlying modelling, they do make it easier to translate complex outputs into intuitive explanations and allow a wider set of stakeholders to interact with the data more directly," he says. "Those factors together have created far more surface area for data science to add value."
MATHEMATICIAN'S GAME
A striking piece of mathematical art hangs behind the desk of Tim Chartier, Professor of Mathematics at Davidson College in the U.S. It is a fragmented version of the Mona Lisa alongside imagery inspired by The Great Wave off Kanagawa by the Japanese artist Katsushika Hokusai. The artwork reflects Chartier's fascination with the intersection of mathematics and aesthetics. As an applied mathematician working within computer science, he has long been drawn to patterns, structures, and visual interpretations of mathematical ideas. This blend of mathematical reasoning and aesthetic curiosity eventually guided him towards sports analytics, where patterns in data can reveal insights hidden within competition.
Chartier's early research did not begin with sports. His work focused on ranking systems, such as those used in internet search engines. In 2008-2009, he and his collaborators adapted these ranking methods to models but initially lacked a clear way to assess whether the results were meaningful. In data science, producing a pattern does not necessarily mean it is significant. Chartier's collaborator, Amy Langville from the College of Charleston, realised that the models could be applied to a men's basketball tournament, popularly known as March Madness. The tournament attracts millions of fans who predict winners.
The Indian sports analytics market was valued at around $56 million in 2025; the global market has already reached about $5.6 billion.
Using mathematical rankings, Chartier and his colleagues predicted how each game in a knockout competition would unfold, round by round, up to the final. They entered these into an ESPN competition. Their model's predictions were more accurate than 97% of the 4 million entries, placing their projections among the top-performing submissions. Remarkably, this success came without any subjective judgment about the teams; Chartier admitted he knew little about the players. But the experience showed him how mathematical analysis could provide clarity that intuition alone might miss.
Another time, three students from Davidson College asked him for help in developing sports analytics for the college men's basketball team. The group met weekly with assistant coaches for two months before the season to develop analytical approaches that could assist the team. What began as a small initiative expanded into a large sports analytics community at Davidson, eventually becoming a student club supported by the institution.
In a 2024 study (bit.ly/Data-NBA), Chartier uses modern NBA tracking data that record player and ball positions multiple times per second. Compared to shots from the late 1990s, the 2022-23 season saw a huge rise in three-point shooting. The paper revisits Francis Anscombe's quartet — four datasets created by the English statistician in 1973 — which shows that data visualisation is as important as the numbers; datasets can have the same averages but look very different when graphed.
Sports analytics can also support coaching decisions. Once, Davidson basketball head coach Bob McKillop observed that every player, barring two hoopsters, made poor shooting decisions within the first 10 seconds of the shot clock. He introduced a rule allowing only the two successful players to shoot during that early window. Later, Chartier's team analysed the data and confirmed the intuition: all other players combined had made only one successful early shot.
Using mathematical rankings, Chartier and his colleagues predicted how each game in a competition would unfold, round by round.
In 2025, Chartier's former student, Kendall L. Thomas, currently a researcher at the University of North Carolina at Chapel Hill, introduced a method called the Quantile Cube to analyse movement patterns of elite female soccer players using GPS tracking data (bit.ly/Quantile-Cube). It organises player movements into categories based on speed, acceleration, and movement direction, creating a three-dimensional framework that helps summarise complex match activity. By analysing data from 23 matches, researchers found clear differences in how players moved during the first and second halves of games. The approach also helps identify unusual matches or player workloads and can support better performance analysis, training planning, and injury management in football.
Chartier believes that analytics is widely accepted as a component of decision-making in sports. Coaches increasingly use data to draft players, plan strategy, and manage workloads.
STATISTICS AS A PLAYER
A devoted football fan and die-hard Chelsea supporter, Shoubhik Mukhopadhyay had a stable job in the Information Technology sector, but yearned for something more. So, he left his profession and enrolled in a sports management course. Today, Mukhopadhyay heads business development for the Asia-Pacific region at Smrt Stats, set up in Dublin in 2016 by Lucknow-born Sarthak Sahai. The company has more than 200 clients — including the Indian national football team and several reputed European football clubs. "Many clients felt innovation had slowed. That was the moment we decided to build something genuinely next-generation," says Sahai.
Smrt Stats analyses football through a layered statistical framework that moves from basic match events to deeper indicators explaining how those events occur. The analysis begins with fundamental measures such as goals, shots, passes, fouls and ball recoveries for both teams and players. It then expands into contextual indicators, including chances created, duels, interceptions and attacking patterns. Goalkeepers are evaluated through parameters such as saved shots and distribution.
Its system evaluates a game using 235 parameters, covering actions such as passes, tackles, saves and key passes. To better capture the quality of play, the system incorporates advanced metrics, such as expected goals, expected assists, and expected threats. Expected goals estimate the probability that a shot will become a goal, based on factors such as distance, angle, and defensive pressure. Expected assists measure how likely a pass will lead to a goal, highlighting players who consistently create chances of goals from various angles. Expected threat tracks how passes and movements increase the probability of scoring as the ball moves into more dangerous areas of the pitch.
The team spent more than three years developing the system, consulting analysts, scouts, and coaches to design tools that addressed practical needs in the sport. It is now close to launching a fully automated data collection system. "Professional analysts rely on three things: tracking data, event data, and video. Our aim is to bring all three together on a single automated platform," says Sahai.
Smrt Stats first identifies a moment or an event in a game using patterns in player movement and positioning, and then uses tracking data to analyse it further. According to the developers, this approach improves the accuracy of identifying complex actions. The system has already been assessed in rugby and is close to deployment in football, with models for other sports, such as tennis, also under development. "Right now, many datasets still require manual tagging. Our goal is to move toward almost complete automation driven entirely by video," Sahai says.
CESSA is developing tools ranging from pressure-measuring insoles to computer-vision systems that track a boxer's ring coverage.
Devrup Jyoti Gupta, a data analyst for Inter Kashi, a football club in the Indian Super League, uses Smrt Stats data for scouting and tactical planning. Gupta explains that the platform helps analysts track player movement inside and around the penalty box by examining positional data and actions from several recent matches. By studying these patterns, coaches can understand how effectively a player moves into crucial areas and penetrates the opponent's box. "It helps coaches evaluate a player's ability to break into the opponent's penalty area and create scoring opportunities," Gupta says.
QUANTIFYING LUCK
Mahesh Panchagnula, head of the Centre of Excellence in Sports Science and Analytics (CESSA) at the Indian Institute of Technology (IIT) Madras, entered the field by accident. In 2018, he co-authored an article for ESPNcricinfo on whether a toss really mattered in Test cricket. The article was never published, but the site's editors were aware of his interest in sports data. Around the same time, a former classmate working at ESPN approached Panchagnula with a challenge: researchers in the U.K. had analysed the role of luck in football. Could something similar be done in cricket?
Panchagnula teamed up with Raghunathan Rangaswamy, Professor of Chemical Engineering at the institute, to tackle the problem. "To quantify luck, you first have to quantify the progression of a match itself," Panchagnula says. The group developed a statistical model based on a convolutional neural network model trained on past IPL matches. The system predicts match outcomes ball by ball, much like language models predict the next word in a sentence. By simulating alternative scenarios, such as a dropped catch being taken, the model can estimate whether luck altered the result of a match.
The work also produced a "pressure index" that values performances according to context. "Scoring 15 off eight balls when your team has only a 30% chance of winning is far more valuable than scoring 15 off 18 balls when the odds are in your favour," Panchagnula says. Such contextual analyses help explain extraordinary performances, such as Australian cricketer Glenn Maxwell's match-turning innings against Afghanistan's national cricket team in the 2023 One Day International (ODI) World Cup, where the impact went far beyond raw numbers.
Panchagnula's broader goal is to build technologies that help athletes and coaches. "Anything in technology that can benefit our athletes is something we want to pursue," he says. The centre is developing tools ranging from pressure-measuring insoles and computer-vision systems that track a boxer's ring coverage to a biomechanics lab equipped with a 13-camera motion-capture system that reconstructs joint angles and movement. These technologies allow coaches to detect subtle changes in posture or technique that are invisible to the naked eye.
SIMPLE AND COMPLEX
Birds and soccer players show comparable collection patterns.
The murmurations of birds and the swarming of bees follow the same mechanism that a football team demonstrates in a match. Physicist David Sumpter, an expert on complex systems, found that the players, like the birds and the bees, display collective patterns. They are part of a complex system, but follow simple rules individually — such as staying close to teammates.
Sumpter applied self-propelled particle models to describe how players move and interact with other players. The model is now being widely used to analyse formation and tactical patterns in football. He also worked on spatial analysis, exploring how players occupy and control space on the pitch, which later informed concepts such as pitch control. He brought these ideas together in his 2016 book Soccermatics.

He has developed a tool that converts football information into a readable and more interpretable format so that anyone — professional clubs, analytics companies, and media platforms — can understand it. Liverpool FC and many other clubs across Europe are using Sumpter's works on spatial control, passing networks, and pattern recognition. His "pitch control" model is now widely used by sports analytics companies such as Hudl and U.K.-based StatsBomb. These models calculate which team is likely to control different areas of the pitch at any given moment, helping refine tactics and positioning.

While CESSA aimed to provide assessments of Indian boxers on specific parameters with a wearable sweat monitor, its current goal is to help both players and coaches and reduce dependence on foreign assistance. To further this effort, Babji Srinivasan, a Professor at the Applied Mechanics department at IIT Madras, and his collaborators led a study titled 'Towards AI enabled automated tracking of multiple boxers', proposing a cost-effective vision-based system that uses a single, fixed top-view camera to track boxers during a bout. The system automatically segments bouts and applies pose-estimation algorithms to follow body landmarks and maintain each boxer's identity during fast movements and clinches. Tests on nearly 11 hours of footage involving 45 athletes showed about 90% accuracy in detecting bout transitions while successfully maintaining identity continuity.
Simple statistics can be misleading. A captain might have a high winning rate but lead only in a few matches.
Researchers at the centre are also investigating the physics of ball flight and bounce in sports such as cricket and table tennis. By measuring the ball's three-dimensional trajectory, spin axis and revolutions per minute before and after impact, they aim to build models that could quantify pitch behaviour, putting numbers to descriptions such as "turning tracks" or "bouncy wickets".
CAPTAINCY BEYOND WINS
Imon Mukherjee, a computer scientist at the Indian Institute of Information Technology (IIIT), Kalyani, West Bengal, was disappointed when Sourav Ganguly was dropped from the Indian cricket team in 2005. To him, the episode highlighted a deeper problem: the absence of a transparent and objective system for evaluating players. Team selection often depended on personal preferences than on measurable evidence. Mukherjee strongly believed that cricket decisions had to be supported by quantifiable methods.
In 2019, his PhD student Nayan Ranjan Das joined him in exploring how mathematics and data science could make such evaluations fair. In one collaborative study, they proposed a systematic way to rank cricket captains using 12 years of IPL data. Their analysis showed that a captain's quality cannot be judged only by the number of matches won. Winning also depends on team strength, match conditions, and luck. A captain's ability includes decision-making, experience, leadership, and performance as a player.
The researchers collected data on 28 IPL captains between 2008 and 2020 and analysed 14 features. Some measured leadership, such as winning percentage, captaincy experience, titles won, and success after winning the toss. Others captured the captain's contribution as a player, including batting average, strike rate, boundaries, wickets, bowling performance, and catches.
Using statistical tools, the researchers assigned weights to these factors and combined them into a ranking system. They aimed to create a balanced evaluation rather than relying on a single statistic, such as winning percentage. The results showed that simple statistics can be misleading. A captain might have a high winning rate but lead only in a few matches, while another may perform consistently over many seasons and contribute strongly as a player.
The researchers also studied how data analysis could reveal deeper insights into bowling performance. Traditional statistics, such as bowling average or economy rate, do not capture a bowler's real impact. Performance often depends on match conditions, the strength of the opposition, and the situation in which the bowler is used.
For a better understanding, the team analysed large datasets from different formats, such as Test matches, ODIs, and T20 cricket. It found, among other things, that bowling in the final overs of a T20 match is particularly challenging. So, the team studied how bowlers performed during the powerplay, middle overs, and death overs. They also looked at the importance of dot balls, which are especially valuable in T20 cricket.
To judge a player's performance, the researchers compared several factors and gave them different weights. Das explains that these weights were based on logical reasoning. For instance, bowlers who conceded more runs were given lower ratings, because allowing too many runs should reduce a bowler's overall score. "Access to large datasets enables prediction of future player effectiveness and supports bench strength development," says Das. Such methods could help identify promising players from club cricket and the Ranji Trophy system while reducing selection bias.
Technology, clearly, is changing the frame of the game. However, mathematician Chartier believes that many aspects of sports are difficult to quantify. Mathematics and data can provide insight into aspects of life, such as friendship or love, but cannot fully capture them. Likewise, in sports.
See also:


For a world-class physics research institute in India
Theoretical physicist Jainendra K. Jain on the excitement, and the challenges, of establishing privately funded research institutes in India.

Space for everyone
Citizens' groups are aiming for the stars — and helping space experts crunch data.
Have a
story idea?
Tell us.
Do you have a recent research paper or an idea for a science/technology-themed article that you'd like to tell us about?
GET IN TOUCH